Showing posts with label Technical Indicators Explained. Show all posts

Parabolic SAR

What is Parabolic SAR?


The Parabolic Stop and Reverse (SAR) indicator combines price and time components to generate buy and sell signals. The Parabolic SAR is also effective as a tool to determine where to place stop loss orders. 

Parabolic SAR Buy Signal

We should buy when the price closes above the upper Parabolic SAR. When the Parabolic SAR changes from being above price to below price, then the stock, futures, or currency trader should "stop" and buy to cover their existing short sell and "reverse" direction and buy to go long.

Parabolic SAR Sell Signal

A sell signal is generated when the price closes below the lower Parabolic SAR. At the time that the Parabolic SAR changes from being below price to being above price, the trader should "stop" and sell to exit their existing long trade and "reverse" direction and sell to go short.


Uses of Parabolic SAR 

An effective use of the Parabolic SAR is determining where to place stop loss orders to protect profits or minimize losses. 


The Parabolic SAR is an effective stop loss placement tool for two reasons:

  • It acts as a trailing stop. Rather than putting in one stop loss below where a trader entered a long position or above where the trader entered a short position, using the Parabolic SAR as a trader's guide, the stop loss is gradually raised for a long position and lowered in a short position, effectively locking in any profits.

  • It acts as a time stop. Time stops are used by traders because they enter in buy or sell orders expecting a certain move to occur. If the expected move never occurs and the reason the trader initiated the trade is no longer relevant, then the trader should exit their trade. Similarly, the Parabolic SAR incorporates time into its calculation making sure a stock, future, or currency trade is working for the trader, if the trade is not moving in the desired direction, the Parabolic SAR will signal an exit.
Parabolic SAR Weaknesses

Parabolic SAR introduces some excellent concepts to technical analysis but leaves two major weaknesses:

  • Trend speeds vary over time and between stocks. It is difficult to arrive at one acceleration factor that suits all trends -- it will be too slow for some and too fast for others.

  • The SAR system assumes that the trend changes every time a stop has been hit. Any trader will tell you that your stops may be hit several times while the trend continues. Price merely retraces through your stop and then resumes the up-trend, leaving you lagging behind. 


.Thank You !

MACD Indicator


What is MACD Indicator?

Moving Average Convergence-Divergence (MACD) indicator is one of the simplest and most effective momentum indicators available. The MACD turns two trend-following indicators, moving averages, into a momentum oscillator by subtracting the longer moving average from the shorter moving average. As a result, the MACD offers the best of both worlds: trend following and momentum. The MACD fluctuates above and below the zero line as the moving averages converge, cross and diverge. Traders can look for signal line crossovers, centerline crossovers and divergences to generate signals. Because the MACD is unbounded, it is not particularly useful for identifying overbought and oversold levels.


Components of MACD

There are three main components of the MACD shown in the picture below:
  1. MACD: The 12-period exponential moving average (EMA) minus the 26-period EMA.
  2. MACD Signal Line: A 9-period EMA of the MACD.
  3. MACD Histogram: The MACD minus the MACD Signal Line.


MACD Formula

The MACD indicator is calculated as the difference between the fast and slow moving averages:

MACD = 12 Day exponential moving average - 26 Day exponential moving average

The signal line is calculated as a 9 day exponential moving average of MACD.

How to trade with the MACD indicator

If the MACD crosses down below the Signal line, but the histogram has not confirmed it by producing bars below the zero line, this is still considered a sell signal, but not as strong.A signal to sell is when the MACD has crossed below the Signal line. The signal is stronger if the histogram bars are also below the zero line.
The image below shows the MACD providing a strong sell signal:

MACD6

  • MACD has crossed down below the Signal line
  • Histogram is below the zero line

If the MACD crosses above the Signal line, but the histogram does not confirm it by having its bars above the zero line, this also gives you a buy signal, but not as strong buy signal is given when the the MACD crosses above the Signal line. If the histogram is above the zero line, then the signal is stronger.
The image below shows the MACD providing a strong buy signal:

MACD7


  • MACD has crossed up above the Signal line
  • Histogram is above the zero line

MACD Moving Average Crossover
Histogram is above the zero linMACD Moving Average CrossovWe know that the MACD line is created from the 12-period and 26-period EMA. Consequently:When the shorter-term 12-period EMA crosses above the longer-term 26-period EMA, the MACD line crosses above the Zero line.

  • When the shorter-term 12-period EMA crosses above the longer-term 26-period EMA, the MACD line crosses above the Zero line.
  • When the 12-period EMA crosses below the 26-period EMA, the MACD line crosses below the Zero line.


MACD Buy Signal

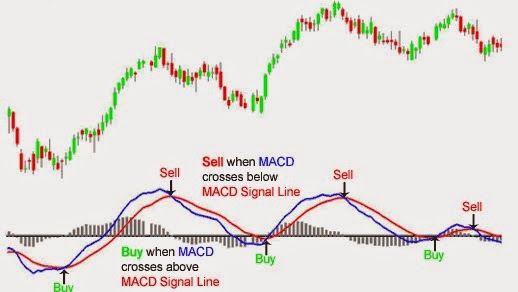
A buy signal is generated when the MACD (blue line) crosses above the MACD Signal Line (red line).

MACD Sell Signal

Similarly, when the MACD crosses below the MACD Signal Line a sell signal is generated.
The MACD moving average crossover is one of many ways to interpret the MACD technical indicator. Using the MACD histogram and MACD divergence warnings are two other important methods of using the MACD.

MACD Histogram

The MACD Histogram is simply the difference between the MACD line (blue line) and the MACD signal line (red line).
 
  • Convergence: The MACD histogram is shrinking in height. This occurs because there is a change in direction or a slowdown in the stock, future, bond, or currency trend. When that occurs, the MACD line is getting closer to the MACD signal line.
  • Divergence: The MACD histogram is increasing in height (either in the positive or negative direction). This occurs because the MACD is accelerating faster in the direction of the prevailing market trend.
When a stock, future, or currency pair is moving strongly in a direction, the MACD histogram will increase in height. When the MACD histogram does not increase in height or begins to shrink, the market is slowing down and is a warning of a possible reversal. 


The letter "T" represents when the top or peak of the MACD histogram occurs. In contrast, the letter "B" shows when the bottom of the MACD histogram occurs. Notice how closely the tops and bottoms of the MACD histogram are to the tops of the Nasdaq 100 e-mini future.

MACD Histogram Buy Signal

When the MACD histogram is below the zero line and begins to converge towards the zero line.

MACD Histogram Sell Signal

When the MACD histogram is above the zero line and begins to converge towards the zero line.

MACD Divergences


Bullish divergence
 occurs when the indicator is indicating that price should be bottoming and heading higher, yet the actual price action is continuing downward.Bearish divergence occurs when a technical analysis indicator is suggesting that a price should be going down but the price of the stock, future, or currency pair is continuing to maintain its current uptrend.

Conclusion

The MACD indicator is special because it brings together momentum and trend in one indicator. This unique blend of trend and momentum can be applied to daily, weekly or monthly charts. The standard setting for MACD is the difference between the 12 and 26-period EMAs. The MACD is not particularly good for identifying overbought and oversold levels. Even though it is possible to identify levels that are historically overbought or oversold, the MACD does not have any upper or lower limits to bind its movement. During sharp moves, the MACD can continue to over-extend beyond its historical extremes.


Thank You !

Stochastics Indicator


What is Stochastic Indicator?


A technical momentum indicator that compares a security's closing price to its price range over a given time period. The oscillator's sensitivity to market movements can be reduced by adjusting the time period or by taking a moving average of the result. 


The indicator consists of two lines:
  • %K compares the latest closing price to the recent trading range.
  • %D is a signal line calculated by smoothing %K.


Calculation

The Stochastic Oscillator has four variables:
  1. %K Periods.
    This is the number of time periods used in the stochastic calculation.
     
  2. %K Slowing Periods.
    This value controls the internal smoothing of %K. A value of 1 is considered a fast stochastic; a value of 3 is considered a slow stochastic.
     
  3. %D Periods.
    This is the number of time periods used when calculating a moving average of %K. The moving average is called "%D" and is usually displayed as a dotted line on top of %K.
     
  4. %D Method.
    The method (i.e., Exponential, Simple, Time Series, Triangular, Variable, or Weighted) that is used to calculate %D.
     
The formula for %K is:


The Stochastic Oscillator always ranges between 0% and 100%. A reading of 0% shows that the security's close was the lowest price that the security has traded during the preceding x-time periods. A reading of 100% shows that the security's close was the highest price that the security has traded during the preceding x-time periods.


Stochastic Theory

The theory behind this indicator is that in an upward-trending market, prices tend to close near their high, and during a downward-trending market, prices tend to close near their low. Transaction signals occur when the %K crosses through a three-period moving average called the "%D".


Types of Stochastic Indicators


Stochastics Fast

It uses shorter Time Periods, and Shorter Averages – this creates more fluctuations but conversely also more false alarms
The Stochastic Fast is charted using the following two lines.
Fast %K: [(Close - Low) / (High - Low)] x 100 (shown as black line above)
Fast %D: Simple moving average of Fast K (3-day MA) (shown as blue “trigger line” above)

Stochastics Slow

It uses longer time periods and longer average periods – this creates a smoother flow and gives the ability to see trends clearer, the drawback is the Indicator lags price and is less responsive.
The Stochastic Slow is charted using the following two lines. 
Slow %K: Equal to Fast %D (3-day MA of Fast %K) (shown as black line above)
Slow %D: Simple moving average of Slow %K (shown as blue “trigger line” above)
Which is better? Well, the Stochastics Slow is usually preferred by most traders because is does not show as many false buy and sell signals.

Comparison of Stochastic Fast and Stochastic Slow


Conclusion

The stochastics indicator is for the most part a range pattern indicator. It is used to determine overbought/oversold levels in a manner similar to the RSI. The oversold level is at 20, while the overbought level resides at 80. Although this is the most basic way of using this indicator, it is in fact rarely used because of the tendency to create false signals. Instead, as with most other oscilators, convergence/divergence patterns are sought between the price and the indicator, and then trading decisions are made sometimes supported by secondary concepts like the price extremes, or crossovers that can sometimes signal momentum changes.
Both for the fast and slow stochastics indicators, indicator crossovers are used to create trade signals on the basis of the movement of the %K component. The %K component is the faster moving of the two components, and when it rises above, or falls below the slower %D, a buy or sell signal will be generated.


Thank You !

Bollinger Bands Indicators

What are Bollinger Bands?

Bollinger Bands is a versatile tool combining moving averages and standard deviations and is one of the most popular technical analysis tools available for traders. 


There are three components to the Bollinger Band indicator:

  • Moving Average: By default, a 20-period simple moving average is used.
  • Upper Band: The upper band is usually 2 standard deviations (calculated from 20-periods of closing data) above the moving average.
  • Lower Band: The lower band is usually 2 standard deviations below the moving average.


Significance of Bollinger Bands


  • Bollinger Bands help you to evaluate a stock’s volatility over time. When plotting Bollinger Bands on a chart will see one line above and one line below the price chart of the stock. When a stock is making major price movements or is very volatile its Bollinger Bands will be farther away (expand) from the stock’s price chart. When a stock is moving steadily with minor price movements, the Bollinger Bands will be closer to (contract upon) the stock’s price chart.

  • When stock prices continually touch the upper Bollinger Band, the prices are thought to be overbought; conversely, when they continually touch the lower band, prices are thought to be oversold, triggering a buy signal.

  • Sharp price changes tend to occur after the bands tighten, as volatility lessens.

  • When prices move outside the bands, a continuation of the current trend is implied.

  • Bottoms and tops made outside the bands followed by bottoms and tops made inside the bands call for reversals in the trend.
  •  


Uses of Bollinger Bands


Bollinger Bounce

A common technical use of Bollinger Bands ® is to predict when a stock’s price will “bounce” off the top or bottom Bollinger line and then return back towards the center of the Bollinger Bands ®. Therefore, giving a bullish indicator to a stock whose price is close to or touching the bottom Bollinger Band and a bearish indicator to a stock whose price is close to or touching the top Bollinger Band.

bollinger bounce

Bollinger bands are intended to illustrate a stock’s current support and resistance levels. This means a low price the stock does well stays above (support) and a high price the stock has difficulty breaking past (resistance).
Bollinger Squeeze

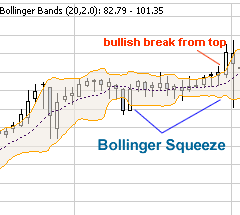
Another common technique used to predict trends with Bollinger Bands ® is called the Bollinger squeeze. When the bands contract so much that they begin to appear to “squeeze” the stock’s price chart, is when the Bollinger squeeze occurs. This is usually a a pending breakout which could be bullish or bearish. Should the stock’s price begin to break above the top Bollinger Band it is a bullish sign that the stock with continue an upward trend. If the stock’s price breaks through the lower band, it is a bearish sign that the downward trend will most likely continue.
bollinger squeeze


Conclusion

Bollinger Bands are a very popular indicator and the article describes many ways on how to use it. However, like most technical indicators, it should not be used alone. Bollinger Bands work best when combined with overbought/oversold oscillators. Since Bollinger Bands already take into account volatility and trend, a trader should not use indicators that duplicate this information. Instead indicators that measure volume, momentum, sentiment, open interest are better suited companions for the Bollinger Bands indicator. It is with this information in mind that the general rules presented here should not be taken by themselves as trading strategies.


Thank You !

Exponential Moving Average


What is Exponential Moving Average?

An Exponential Moving Average (EMA) assigns a weighting factor to each value in the data series according to its age. Here, too, the most recent data gets the greatest weight and each price value gets a smaller weight as we go back in the series chronologically. The weight of each data point decreases exponentially, hence the name.

First, calculate the simple moving average. An exponential moving average (EMA) has to start somewhere so a simple moving average is used as the previous period's EMA in the first calculation. Second, calculate the weighting multiplier. Third, calculate the exponential moving average. The formula below is for a 10-day EMA.

SMA: 10 period sum / 10 

Multiplier: (2 / (Time periods + 1) ) = (2 / (10 + 1) ) = 0.1818 (18.18%)

EMA: {Close - EMA(previous day)} x multiplier + EMA(previous day). 

Significance of EMA

Critics of the simple moving average argue that it is too simple in the sense that it gives the same weight to each point in moving average calculation. The problem with this it is argued is that the more recent data points deserve a greater weighting in the formula as they are more relevant to the future price action of the instrument. 

To solve this problem traders came up with the exponential moving average, which gives more weight to the more recent price points in calculating the moving average line.

Calculation

To Calculate an EMA
Current EMA= ((Price(current) - previous EMA)) X multiplier) + previous EMA. 


 The most important factor is the smoothing constant that = 2/(1+N) where N = the number of days. 


 A 10-day EMA = 2/( 10+1) = 18.8


 This means a 10-period EMA weights the most recent price 18.8%, a 20-day EMA 9.52 % and 50-day EMA 3.92% weight on the most recent day. The EMA works by weighting the difference between the current period's price and the previous EMA, and adding the result to the previous EMA. The shorter the period, the more weight applied to the most recent price.

With the EMA the calculation is a bit more complex in that it weighs the different closing prices within the moving average range. The EMA gives more weight to prices near the end of the range and less to those prices in the beginning of the range. This gives more influence to the current market activities of the stock. 

moving average ema


Thank You !

Simple Moving Average

What is Simple Moving Average?

The Simple Moving Average is arguably the most popular technical analysis tool used by traders. The Simple Moving Average (SMA) is used mainly to identify trend direction, but is commonly used to generate buy and sell signals. The SMA is an average, or in statistical term - the mean.


A simple moving average is formed by computing the average price of a security over a specific number of periods. Most moving averages are based on closing prices. A 5-day simple moving average is the five day sum of closing prices divided by five. As its name implies, a moving average is an average that moves. Old data is dropped as new data comes available. This causes the average to move along the time scale. Below is an example of a 5-day moving average evolving over three days.

Daily Closing Prices: 11,12,13,14,15,16,17 
First day of 5-day SMA: (11 + 12 + 13 + 14 + 15) / 5 = 13
Second day of 5-day SMA: (12 + 13 + 14 + 15 + 16) / 5 = 14
Third day of 5-day SMA: (13 + 14 + 15 + 16 + 17) / 5 = 15

Popular Simple Moving Averages 
5 – SMA – For the hyper trader.  This short of an SMA will constantly give you signals.  The best use of a 5-SMA is as a trade trigger in conjunction with a longer SMA period.
10 - SMA – popular with the short-term traders.  Great swing traders and day traders.
20 - SMA – the last stop on the bus for short-term traders.  Beyond 20-SMA you are basically looking at primary trends.
50 - SMA – use the trader to gauge mid-term trends.
200 - SMA – welcome to the world of long-term trend followers.  Most investors will look for a cross above or below the average to represent if the stock is in a bullish or bearish trend.

Simple Moving Average Example


simple moving averages

The above chart shows 3 examples of simple moving averages. Obviously, the closer the time span gets to 0 days, the closer it represents the actual price chart, and the faster it responds to price trends. The opposite is also true, the greater the number of days used to calculate the SMA the less quickly it responds to the current price trend.

Moving Average Acting as Support - Buy Signal

The chart below of the Dow Jones Industrial Average exchange traded fund (DIA) shows a 20-day Simple Moving Average acting as support for prices. When price is in an uptrend and subsequently, the moving average is in an uptrend, and the moving average has been tested by price and price has bounced off the moving average a few times (i.e. the moving average is serving as a support line), then buy on the next pullbacks back to the Simple Moving Average.


Moving Average Acting as Resistance - Sell Signal

At times when price is in a downtrend and the moving average is in a downtrend as well, and price tests the SMA above and is rejected a few consecutive times (i.e. the moving average is serving as a resistance line), then buy on the next rally up to the Simple Moving Average.

A Simple Moving Average can serve as a line of resistance as the chart of the DIA shows:


Thank You !

Moving Averages

What are Moving Averages?

  • Moving averages are one of the most popular and easy to use tools available to the technical analyst. They smooth a data series and make it easier to spot trends, something that is especially helpful in volatile markets. They also form the building blocks for many other technical indicators and overlays.


Significance of Moving Average

  • The Moving Average Technical Indicator shows the mean instrument price value for a certain period of time. When one calculates the moving average, one averages out the instrument price for this time period. As the price changes, its moving average either increases, or decreases. 

  • Moving averages may also be applied to indicators. That is where the interpretation of indicator moving averages is similar to the interpretation of price moving averages: if the indicator rises above its moving average, that means that the ascending indicator movement is likely to continue: if the indicator falls below its moving average, this means that it is likely to continue going downward.

  • The two most popular types of Moving average are Simple Moving Average (SMA) and Exponential Moving Average (EMA)  

Uses of Moving Average

Trend identification/confirmation

  • The first trend identification technique uses the direction of the moving average to determine the trend. If the moving average is rising, the trend is considered up. If the moving average is declining, the trend is considered down. The direction of a moving average can be determined simply by looking at a plot of the moving average or by applying an indicator to the moving average. In either case, we would not want to act on every subtle change, but rather look at general directional movement and changes.


  • The second technique for trend identification is price location. The location of the price relative to the moving average can be used to determine the basic trend. If the price is above the moving average, the trend is considered up. If the price is below the moving average, the trend is considered down.


  • The third technique for trend identification is based on the location of the shorter moving average relative to the longer moving average. If the shorter moving average is above the longer moving average, the trend is considered up. If the shorter moving average is below the longer moving average, the trend is considered down.


Support and Resistance level identification/confirmation

Another use of moving averages is to identify support and resistance levels. This is usually accomplished with one moving average and is based on historical precedent. As with trend identification, support and resistance level identification through moving averages works best in trending markets.

Conclusion

  • Moving averages can be effective tools to identify and confirm trend, identify support and resistance levels, and develop trading systems. However, traders and investors should learn to identify securities that are suitable for analysis with moving averages and how this analysis should be applied. 
  • The advantages of using moving averages need to be weighed against the disadvantages. Moving averages are trend following, or lagging, indicators that will always be a step behind. This is not necessarily a bad thing though. Moving averages will help ensure that a trader is in line with the current trend. However, markets, stocks and securities spend a great deal of time in trading ranges, which render moving averages ineffective. Once in a trend, moving averages will keep you in, but also give late signals. Don't expect to get out at the top and in at the bottom using moving averages. As with most tools of technical analysis, moving averages should not be used on their own, but in conjunction with other tools that complement them. Using moving averages to confirm other indicators and analysis can greatly enhance technical analysis.


Thank You !