Technical Analysis by Candlesticks


What are Candlesticks?

  • In technical analysis, a Candlestick pattern is a movement in prices shown graphically on a candlestick chart that some believe can predict a particular market movement. 

  • When data is fed from exchange and integrated into various charting software's like Amibroker, Metastock, Metatrader etc, candlesticks are generated which depicts movement of price and thus shows a pattern of any stock performance. Candlesticks are very effective for Technical Analysis as they help in forecasting future price movement as to in which direction it will move, either upwards, downwards or sideways. 

  • Candlesticks are graphical representations of price movements for a given period of time. They are commonly formed by the opening, high, low, and closing prices of a financial instrument.


Candle Stick Parts


Candlesticks contain the same data as a normal bar chart but highlight the relationship between opening and closing prices. The narrow stick represents the range of prices traded during the period (high to low) while the broad mid-section represents the opening and closing prices for the period.

  • When the closing price of the candlestick is greater than the opening price, then the candle is a Bullish candlestick and is represented by a white or green candlestick real body. Conversely, if the closing price is less than the opening price, then the candlestick is a Bearish candlestick and is represented by a black or red candlestick real body. 
The advantage of candlestick charts is the ability to highlight trend weakness and reversal signals that may not be apparent on a normal bar chart.


Conclusion

Candlestick patterns have become the single most accurate means of identifying the ever obscure current state of price action .  By virtue of open, close, high, low and those relative to the previous bar candlestick charts are the best way for a trader to identify excellent trade opportunities. 


Thank You !

Online Trading Concepts


What is Online Trading ? 


  • Online trading is a platform provided to the investors (both big and small) through the internet; to enable them to transact (that is buy and sell) the various financial instruments available with and through the stock exchange you choose to transact through. 
  • The Online trading platforms are provided by some lead banks; like SBI, HDFC Bank & HDFC Securities, Kotak Mahindra Bank amongst other. And also by some brokerage houses like Sharekhan, Indiabulls etc. 
  • These online trading platforms allow you to trade or transact on both the NSE and BSE. The financial instruments available to you would be stocks (cash-and-carry), futures & options, mutual funds and IPOs. All the above is done in a seamless fashion; and aside from being very efficient for the investor it also reduces the transaction cost for both the investor and the intermediary providing the service. 


How to Trade Online ? Getting Started !! 

  • If you are seriously considering to invest in the stock market investment, Online Share Trading is the easiest and the safest option you have got. There are so many reputed online stock trading websites that have implemented state of the art facilities for the retail investors. You can buy and sell stocks online through these websites without any hassles and there are so many other benefits as well. Apart from the fact that online trading is hassle free, the biggest advantage of the online trading account is that they charge considerably lower brokerage for stock trading in comparison with the traditional stock brokers
  • To begin investing onlinewe need to register as a member for an integrated 3-in-1 online trading account with any of the service providers.The three accounts are:
  1. Trading account, which enables you to transact online.
  2. An Internet enabled bank account for online money transfers through Internet.
  3. A Demat account, where your shares will be deposited.

  • In India most of the online trading portals lets you trade in both the major stock exchanges in India – The BSE and NSE. Through online trading account you can do delivery based trading, margin trading as well as derivative trading. Apart from these basic stock trading procedures most of the online stock trading websites also lets you invest in the IPO(Initial Public Offer) and mutual funds as well. So, no more filling up the lengthy forms and no more signing cheques for buying the IPO or investing in the mutual funds, now you can do that with a click of the mouse from your online trading account.

Traditional Trading vs Online Trading


In traditional trading, all your activities are carried out with the aid of brokers where they help you in the entire process while spending a lot of time. and money as well. Whereas in Online Trading, the stock brokers have a platform in the form of special websites created for trading of stocks. These platforms are instrumental in providing extra information and keep track of all the trading details through your online trading account. It helps to keep us abreast with - 
  • Market Data
  • Charts
  • News
  • Alerts

There are various levels provided for the market data. Every level of market data is required by the day traders who make their decisions all by themselves. Traders have the liberty to trade in more that one product, ECN (Electronic Communication Network) or one market with just one account and software. There are various advantages and disadvantages associated with the Online Trading which are outlined below - 

Advantages of Online Trading 


  • It provides a wealth of information, analysis and tools that enable you to take more informed decisions, virtually no paperwork involved as all transaction records are online and statements available in digital form, invest anytime and from anywhere at your time and convenience.
  • It allows you to trade across various segments like Equity Shares, Mutual Funds and IPOs, amongst others. You can also get up-to-date information and analysis in an investor friendly format, from some of the best information providers in their respective fields. 
  • Online Stock trading, unlike every other business, is an excellent way to make quick money. Investors see very quick turnarounds on their online investments.  The well-educated and experienced investor can make money in just the time it takes them to click through a transaction because online investing has virtually eliminated the lag time between purchases and proof of the stock in a portfolio. Additionally, investors don’t have to worry about or budget for advertising or tempting customers!
  • There is no Investment limits in Online Trading. Typical brokers typically impose limits on investors, requiring them to spend a certain amount of money.  But online brokering is steered by the client, and they can spend as much or as little as they like.  Brokers also may impose a minimum trade requirement, but the online investor can decide to trade only one stock at a time if they decide that is their ideal business model.
  • Lower Brokerage Fees. Fees can be even more lower for frequent Trader. Online trading favors active traders, who trade in bulk but demand lesser commission.
  • Good research tools and News feeds on each stock, which you can delve deeper into in your own time. A conventional offline broker may not always be able or willing to offer you all of these. 


Disadvantages of Online Trading


  • There is reduction of professional support thus making it vulnerable to risks. Online Trading reduces the amount of professional support you’re receive when making buy or sell decisions. 
  • There is no relationship that of a mentor between a professional broker and an online trading account holder, thus leaving the investor on his own to make choices of the right shares. Users who are not familiar with the ins and outs of the basics of brokerage software can make mistakes which can prove to be a costly affair.
  • There is probability of trading loss in case of technical or platforms malfunctions. Sometimes, Internet connection can be a problem or the website itself loads very slow.
  • Many products to choose from (there are 1000's of stocks) which is often overwhelming to new traders

Common Mistakes in Online Trading 

  • Avoid the mistake of placing Market Orders in Volatile Market as you may get exposed to the sudden price swings
  • Avoid the mistake of placing the wrong type of order in error. There are many types of brokerage orders and they can be confusing, but it is important to understand the difference when placing your own trades to avoid unintentional errors.
  • If you bought the wrong stock. Don't sell it just yet. Quickly make an assessment to determine if the trade is going for or against you. First, determine the spread and possible exit points. Check the Prints and see if you are getting appropriate signals. Regardless, if it is going up, let it run, offer into the momentum and take a quick profit. Consider it a gift. If it is not going your way, exit quickly. Do not waste time rationalizing the trade.
  • The computer system goes down. No system is immune to occasional bog-downs. Whether the source of the problem is with the brokerage, the data source or with the entire exchange itself, avoid trading until it is fixed. Know what open positions you have and write them on a piece of paper. If you wish to exit that position, write down a specific buy or sell order (stock symbol, market or limit order, buy or sell, price and share size) and hand it to the licensed broker in the office if you are trading in an office, or phone in the order execution.
  • If you are in a situation where you cannot concentrate. it'll be wise enough not to trade at that point of time to avoid unavoidable mistakes.


Thank You !

      Technical Indicators


      What is a Technical Indicator? 


      A technical indicator is a series of data points that are derived by applying a formula to the price data of a security. Price data includes any combination of the open, high, low or close over a period of time. Some indicators may use only the closing prices, while others incorporate volume and open interest into their formulas. The price data is entered into the formula and a data point is produced. 

      For example, the average of 3 closing prices is one data point ( (51+56+54) / 3 = 53.66 ). However, one data point does not offer much information. A series of data points over a period of time is required to create valid reference points to enable technical analysis. By creating a time series of data points, a comparison can be made between present and past levels. 


      Why are Technical Indicators used?


      Indicators serve three broad functions: to alert, to confirm and to predict.


      • An indicator can act as an alert to study price action a little more closely. If momentum is waning, it may be a signal to watch for a break of support. Or, if there is a large positive divergence building, it may serve as an alert to watch for a resistance breakout.
      • Indicators can be used to confirm other technical analysis tools. If there is a breakout on the price chart, a corresponding moving average crossover could serve to confirm the breakout. 
      • Some investors and traders use indicators to predict the direction of future prices.


      Tips for using Indicators -


      • When using Technical Indicators in the analysis of Stock Markets, the first requirement is to identify the trend. Once the trend has been identified, the trader can then apply some of the commonly used Indicators mentioned above: Moving Averages, MACD, the RSI, the Stochastic and Bollinger Bands. Technical indicators are used to know when to enter or exit a trade. If you know how to enter and exit a trade, you can easily make profits. That is why choosing good stock indicators are important. 

      • Indicators indicate. This may sound straightforward, but sometimes traders ignore the price action of a security and focus solely on an indicator. Indicators filter price action with formulas. As such, they are derivatives and not direct reflections of the price action. This should be taken into consideration when applying analysis. Any analysis of an indicator should be taken with the price action in mind. What is the indicator saying about the price action of a security? Is the price action getting stronger? Weaker?

      • Even though it may be obvious when indicators generate buy and sell signals, the signals should be taken in context with other technical analysis tools. An indicator may flash a buy signal, but if the chart pattern shows a descending triangle with a series of declining peaks, it may be a false signal.


      Conclusion


      When choosing an indicator to use for analysis, choose carefully and moderately. Attempts to cover more than five indicators are usually useless. It is best to focus on two or three indicators and learn their intricacies inside and out. Try to choose indicators that complement each other, instead of those that move in unison and generate the same signals. 


      Indicator Formula


      Understanding the formulas behind the different Indicators


      Formulas of Indicators can be a very tedious and daunting task to understand. All one needs to understand is the meaning of the indicators and what does it indicates. Indicators are calculations based on price and volume history of a ticker. There are many different indicators, each with a unique formula used to measure such things as volatility,momentum, trend and money flow. Indicators can be displayed in separate panels above or below the main price panel, or in some case right on the chart behind price. To add an indicator, simply select it in the drop down list, modify any of the default parameters if so desired, and select the position where it should appear (Below, Above or Behind Price). Many of the indicators have complicated formulas, and entire books can and have been written on several of them. As such, below is a list of each indicator with only a quick description of each.


      Deriving Technical Analysis Indicators


      • A technical indicator is a result of mathematical calculations based on indications of combinations of price, time and volume. The values obtained are used to forecast probable price changes. It is a series of data points that are derived by applying a formula to the price data of a security. This price data applies to any combination of the open, high, low, or close over a period of time. The price data is entered into the formula and a data point is produced.


      • Technical analysis indicators are derived from technical charts – which can be graphical or pictorial representations of the market activity in terms of upward or downward movements in stock prices over a period of time. However, some technical chart formations may also take into account trading volumes in the calculations.


      • Mathematically, a technical chart is a plot of a set of price data (on the vertical axis) and a function of time (on the horizontal axis). This price data can include a stock’s opening price, closing price, the day’s high or low price, average price, or a combination of these. The plotted data points on the chart can show as individual points or as small bars.


      • When all the data points on the chart are joined, a wave-like pattern is obtained. This pattern is then subjected to technical analysis by experts, who apply standard mathematical formulae to these price movements in order to arrive at technical indicators, from which they can predict the future market price of a stock or its market trend (upward/downward movement).


      Thank You !

      Indicator Types

      What are the types of Indicators?


      Technical indicators can be categorized into several types, depending on how they present the data and the kind of market conditions for which they are best suited.

      • Trend Indicators, as their name suggests, are most useful in identifying or confirming price trends and in spotting points when a trend may be ending or a new trend may be starting to emerge.
      • Momentum indicators are most useful in detecting shifts in trading activity in trading or non-trending market conditions where markets spend much of their time. They are also often known as oscillators and can be split further into those that are based on a neutral center or zero line with no limit on the extent of the indicator reading and those that are confined to a limited range by boundaries or thresholds, often set at 0 and 100.
      • Volatility Indicators measure the degree of variation in price movement within a given period of time and how it compares to historical price movements.
      • Strength and Sentiment Indicators are used in conjunction with price-based indicators to get clues about traders' responses to price activity or perceptions about future price movement.
      • Stock market indicators provide readings that are specifically related to trading activity in stocks and offer insights into potential price movement based on the opinions and actions of traders.

      Indicators can also be classified into other  2 distinct types also. They are Leading Indicators and Lagging Indicators.


      • Leading Indicators are indicators that lead price movement. In other words, they indicate the probability of a trend reversal in advance. Most leading indicators measure price momentum over a fixed look-back period. Some of the popular leading indicators include the Commodity Channel Index (CCI), the Relative Strength Index (RSI), the Stochastic Oscillator etc


      • Lagging Indicators, which follow the price movement, are usually trend-following indicators, such as the moving averages (MA) and Moving Average Convergence/Divergence (MACD). These indicators turn only after the price action has already turned and therefore lag price action.


      Leading Indicators vs Lagging Indicators 


      • Leading indicators change before the underneath commodity changes, whereas lagging indicators are usually behind, or follow the event.


      • The main benefits of leading indicators is the early signaling for entry and exit, it generates more signals and allows more opportunities to trade in trading markets.


      • Lagging indicators follow the price action and are also known as trend-following indicators. Trend-following indicators work best when markets or securities develop a strong trend and signals traders to take long position and keep holding the position as long as the trend is intact. 


      Thank You !

      Trend Indicators

      What are Trend Indicators?

      • The main purpose of a trend indicator is to identify the existence and direction of a trend. These indicators accomplish this by smoothing the price action of a security and tend to be lagging indicators as they are based on past price action. Thus, they tend to follow price action and are sometimes referred to as trend following indicators.


      • Trend indicators attempt to provide an objective measure of the direction of the trend. Price data are smoothed and the trend is represented by a single line. Because of the smoothing process the indicators tend to lag price changes. Signals of trend indicators are reliable in trending markets. 


      Types of Trend Indicators


      • Average Directional Movement Index 
      • Accumulation Swing Index 
      • Bollinger Bands  
      • Commodity Channel Index (CCI) 
      • Directional Movement System 
      • Mass Index 
      • Moving Average Convergence/Divergence (MACD) 
      • Moving Average   
      • Parabolic SAR  
      • Pivot Points Support and Resistance Lines  
      • Standard Deviation  
      • TRIX indicator  
      • Williams` Accumulation/Distribution  
      • Percentage Price Oscillator (PPO)


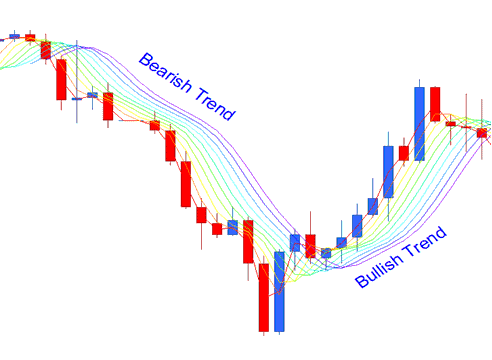
      Trend Indicator Explanations

      1. Crossovers 

      - used to forecast the future movements in the price of a stock such as when a stock or index moves above (bullish) or below (bearish) its 20-day moving average.
      When a security’s long-term moving average (e.g. 50-day ma or ema) moves above its short-term moving average (e.g. 20-day ma or ema) it is referred to as a Death Cross and indicates a bear market on the immediate horizon, especially when it is reinforced by high trading volumes. Conversely, when a security’s short-term moving average moves above its long-term moving average, coupled with high trading volumes, it is referred to as a Golden Cross and indicates a bull market on the immediate horizon.
      2. Moving Average Convergence Divergence (MACD) 


      - When the resultant MACD falls below the signal line, it is a bearish signal, which indicates that it may be time to sell. Conversely, when the MACD rises above the signal line, the indicator gives a bullish signal, which suggests that the price of the asset is likely to experience upward momentum. Many traders wait for a confirmed cross above the signal line before buying or selling to avoid doing so too early and thereby avoid being ‘faked out’.
      Traders also watch for a move above or below the zero line because this signals the position of the short-term average relative to the intermediate-term average. When the MACD is above zero, the short-term average is above the intermediate-term average, which signals upward momentum. The opposite is true when the MACD is below zero. The zero line often acts as an area of support and resistance for the indicator.

      3. Percentage Price Oscillator (PPO)


      - similar to the MACD but while the MACD shows the simple difference between the 2 exponential moving averages the PPO expresses this difference as a percentage which allows a trader to compare stocks with different prices more easily.
      For example, regardless of the stock’s price, a PPO result of 10 means the short-term average is 10% above the intermediate-term average. That makes it much easier to choose one stock over another should the need arise.
      4. Keltner Channels 


      - moving average bands/channels where the upper line represents the average high of a security over a 10-day period; the lower band the average low of a security over a 10-day period and the center line the closing price of a security over the same 10-day period.
      The trader is to sell the security when the closing price exceeds the upper band and to buy the security when the closing price falls outside the lower band. Like the other indicators mentioned it is best to add two or three other indicators to one’s charts to confirm any buy/sell signal.

      5. Parabolic SAR


      - used to determine the direction of a security’s momentum and the point in time when this momentum has a higher-than-normal probability of switching directions.
      The parabolic SAR is shown as a series of dots placed either below a security’s price on a chart (a bullish signal causing traders to expect the momentum to remain in the upward direction) or above (a signal that the bears are in control and that the momentum is likely to remain downward).
      As the price of the security rises, the dots will rise as well, first slowly (i.e. spaced well apart) and then picking up speed (i.e. getting closer and closer together) and accelerating with the trend. This accelerating system allows the investor to watch the trend develop and establish itself. The SAR starts to move a little faster as the trend develops and the dots soon catch up to the price line and that is when it is time to buy the security. A sell signal is triggered when the price line moves below the lower dot enabling an investor to position a stop-loss order.
      The ability for the parabolic SAR to respond to changing conditions removes all human emotion and allows the trader to be disciplined. On the other hand, while the SAR works extremely well when a security is trending, it can lead to many false signals when the price moves sideways or is trading in a choppy market. That being the case, it is paramount that other indicators such as the stochastic oscillator, moving averages, etc. be used to ensure that all information is being considered.

      6. Traders’ Index (TRIN)
      - a short-term breadth indicator which measures the ratio of advancing stocks to declining stocks and compares it to the ratio of advancing volume to declining volume.
      When advancing volume exhibits discordance with the raw number of advancing stocks, the all-important sell signal is given. Conversely, when volume on the downside increases out of proportion with the number of declining stocks, an upside reversal is said to be imminent.
      When interpreted properly, TRIN can be one of the most powerful and accurate means of assessing the psychology of the market.

      7. Advance/Decline Line (A/D) 


      - used to confirm the strength of a current trend and its likelihood of reversing. If the markets are up but the A/D line is sloping downwards, it’s usually a sign that the markets are losing their breadth and may be setting up to head in the other direction. If the slope of the A/D line is up and the market is trending upward then the market is said to be healthy.


      Thank You !

      Momentum Indicators

      What are Momentum Indicators?


      The Momentum indicator compares where the current price is in relation to where the price was in the past. How far in the past the comparison is made is up to the technical analysis trader. The calculation of Momentum is quite simple (n is the number of periods the technical trader selects):
      • The current price minus the price n-periods ago
      Hence, if the current price is higher than the price in the past, then the Momentum indicator is positive. In contrast, when the current price is lower than the price in the past, then the Momentum indicator is negative.

      The momentum indicator identifies when the price is moving upwards or downwards, and also by how much the price is moving upwards or downwards. When the momentum indicator is above 0 (zero), the price has upwards momentum, and when the momentum indicator is below 0 (zero) the price has downwards momentum. The momentum indicator can be used on its own, or as part of a larger trading system.

      Popular Momentum Indicators Explained


      1. Stochastic Oscillator (SO) 
      - compares a security’s closing price to its price range over a given period of time. The theory behind this indicator is that in an upward-trending market, prices tend to close near their high, and during a downward-trending market, prices tend to close near their low.
      2. Relative Strength Index (RSI) 
      - compares the magnitude of recent gains in price to recent losses in an attempt to determine overbought and oversold conditions of a security.
      The RSI, on a scale of 0-100, indicates that a stock is overbought when it is over 70 and oversold when it is below 30. Because large surges and drops in the price of a security will create false buy or sell signals the RSI works best when it is used in conjunction with short-term moving average crossovers such as the Stochastic Oscillator to confirm a directional shift.
      3. StochRSI 

      - created by applying the Stochastic Oscillator to the Relative Strength Index values rather than standard price data thereby giving the trader a better idea of whether the current RSI value is overbought or oversold – a measure that becomes specifically useful when the RSI value is confined between its signal levels of 30 and 70.
      4. TRIX 

      - displays the percent rate-of-change of a triple exponentially smoothed moving average of a security’s closing price and is designed to filter out stock movements that are insignificant to the larger trend of the security.
      The user selects a number of periods (such as 15) with which to create the moving average, and those cycles that are shorter than that are filtered out. TRIX is also a leading indicator and can be used to anticipate turning points in a trend through its divergence with the security’s price.
      5. Commodity Channel Index (CCI)


      - an oscillator which quantifies the relationship between the security’s price, a moving average of the security’s price, and normal deviations from that average to determine when a security has been overbought or oversold.
      The CCI, when used in conjunction with other oscillators, can be a valuable tool to identify potential peaks and valleys in the security’s price, and thus provide investors with reasonable evidence to estimate changes in the direction of price movement of the security.
      6. Price Rate of Change (ROC)


      - measures the percentage rate of change, indicating the strength of the momentum, between the most recent price and the price over “x” periods (the narrower the better) thereby identifying bullish or bearish divergences. As such, the ROC is able to forecasts sooner than almost any other indicator an upcoming reversal of a trend and whether or not a security’s price action is created by those over-buying or over-selling it. A number other than zero (a personal choice) can be used to indicate an increase in upward momentum and a number less than zero to indicate an increase in selling pressure.

      Thank You !