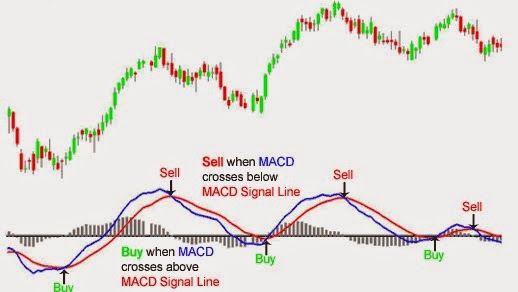
Moving Average Convergence-Divergence (MACD) indicator is one of the simplest and most effective momentum indicators available. The MACD turns two trend-following indicators, moving averages, into a momentum oscillator by subtracting the longer moving average from the shorter moving average. As a result, the MACD offers the best of both worlds: trend following and momentum. The MACD fluctuates above and below the zero line as the moving averages converge, cross and diverge. Traders can look for signal line crossovers, centerline crossovers and divergences to generate signals. Because the MACD is unbounded, it is not particularly useful for identifying overbought and oversold levels.
Components of MACD
There are three main components of the MACD shown in the picture below:
- MACD: The 12-period exponential moving average (EMA) minus the 26-period EMA.
- MACD Signal Line: A 9-period EMA of the MACD.
- MACD Histogram: The MACD minus the MACD Signal Line.
MACD Formula
The MACD indicator is calculated as the difference between the fast and slow moving averages:
MACD = 12 Day exponential moving average - 26 Day exponential moving average
The signal line is calculated as a 9 day exponential moving average of MACD.
How to trade with the MACD indicator
If the MACD crosses down below the Signal line, but the histogram has not confirmed it by producing bars below the zero line, this is still considered a sell signal, but not as strong.A signal to sell is when the MACD has crossed below the Signal line. The signal is stronger if the histogram bars are also below the zero line.
The image below shows the MACD providing a strong sell signal:
- MACD has crossed down below the Signal line
- Histogram is below the zero line
If the MACD crosses above the Signal line, but the histogram does not confirm it by having its bars above the zero line, this also gives you a buy signal, but not as strong buy signal is given when the the MACD crosses above the Signal line. If the histogram is above the zero line, then the signal is stronger.
The image below shows the MACD providing a strong buy signal:
- MACD has crossed up above the Signal line
- Histogram is above the zero line
MACD Moving Average Crossover
Histogram is above the zero linMACD Moving Average CrossovWe know that the MACD line is created from the 12-period and 26-period EMA. Consequently:When the shorter-term 12-period EMA crosses above the longer-term 26-period EMA, the MACD line crosses above the Zero line.
- When the shorter-term 12-period EMA crosses above the longer-term 26-period EMA, the MACD line crosses above the Zero line.
- When the 12-period EMA crosses below the 26-period EMA, the MACD line crosses below the Zero line.
MACD Buy Signal
A buy signal is generated when the MACD (blue line) crosses above the MACD Signal Line (red line).
MACD Sell Signal
Similarly, when the MACD crosses below the MACD Signal Line a sell signal is generated.
The MACD moving average crossover is one of many ways to interpret the MACD technical indicator. Using the MACD histogram and MACD divergence warnings are two other important methods of using the MACD.
MACD Histogram
The MACD Histogram is simply the difference between the MACD line (blue line) and the MACD signal line (red line).
- Convergence: The MACD histogram is shrinking in height. This occurs because there is a change in direction or a slowdown in the stock, future, bond, or currency trend. When that occurs, the MACD line is getting closer to the MACD signal line.
- Divergence: The MACD histogram is increasing in height (either in the positive or negative direction). This occurs because the MACD is accelerating faster in the direction of the prevailing market trend.
When a stock, future, or currency pair is moving strongly in a direction, the MACD histogram will increase in height. When the MACD histogram does not increase in height or begins to shrink, the market is slowing down and is a warning of a possible reversal.
The letter "T" represents when the top or peak of the MACD histogram occurs. In contrast, the letter "B" shows when the bottom of the MACD histogram occurs. Notice how closely the tops and bottoms of the MACD histogram are to the tops of the Nasdaq 100 e-mini future.
MACD Histogram Buy Signal
When the MACD histogram is below the zero line and begins to converge towards the zero line.
MACD Histogram Sell Signal
When the MACD histogram is above the zero line and begins to converge towards the zero line.
MACD Divergences
Bullish divergence occurs when the indicator is indicating that price should be bottoming and heading higher, yet the actual price action is continuing downward.Bearish divergence occurs when a technical analysis indicator is suggesting that a price should be going down but the price of the stock, future, or currency pair is continuing to maintain its current uptrend.
Conclusion
The MACD indicator is special because it brings together momentum and trend in one indicator. This unique blend of trend and momentum can be applied to daily, weekly or monthly charts. The standard setting for MACD is the difference between the 12 and 26-period EMAs. The MACD is not particularly good for identifying overbought and oversold levels. Even though it is possible to identify levels that are historically overbought or oversold, the MACD does not have any upper or lower limits to bind its movement. During sharp moves, the MACD can continue to over-extend beyond its historical extremes.
Thank You !


No comments:
Post a Comment