What is Simple Moving Average?
The Simple Moving Average is arguably the most popular technical analysis tool used by traders. The Simple Moving Average (SMA) is used mainly to identify trend direction, but is commonly used to generate buy and sell signals. The SMA is an average, or in statistical term - the mean.
Daily Closing Prices: 11,12,13,14,15,16,17

The Simple Moving Average is arguably the most popular technical analysis tool used by traders. The Simple Moving Average (SMA) is used mainly to identify trend direction, but is commonly used to generate buy and sell signals. The SMA is an average, or in statistical term - the mean.
A simple moving average is formed by computing the average price of a security over a specific number of periods. Most moving averages are based on closing prices. A 5-day simple moving average is the five day sum of closing prices divided by five. As its name implies, a moving average is an average that moves. Old data is dropped as new data comes available. This causes the average to move along the time scale. Below is an example of a 5-day moving average evolving over three days.
First day of 5-day SMA: (11 + 12 + 13 + 14 + 15) / 5 = 13
Second day of 5-day SMA: (12 + 13 + 14 + 15 + 16) / 5 = 14
Third day of 5-day SMA: (13 + 14 + 15 + 16 + 17) / 5 = 15
Popular Simple Moving Averages
5 – SMA – For the hyper trader. This short of an SMA will constantly give you signals. The best use of a 5-SMA is as a trade trigger in conjunction with a longer SMA period.
10 - SMA – popular with the short-term traders. Great swing traders and day traders.
20 - SMA – the last stop on the bus for short-term traders. Beyond 20-SMA you are basically looking at primary trends.
50 - SMA – use the trader to gauge mid-term trends.
200 - SMA – welcome to the world of long-term trend followers. Most investors will look for a cross above or below the average to represent if the stock is in a bullish or bearish trend.
Simple Moving Average Example

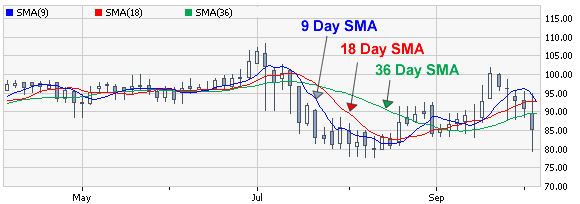
The above chart shows 3 examples of simple moving averages. Obviously, the closer the time span gets to 0 days, the closer it represents the actual price chart, and the faster it responds to price trends. The opposite is also true, the greater the number of days used to calculate the SMA the less quickly it responds to the current price trend.
Moving Average Acting as Support - Buy Signal
The chart below of the Dow Jones Industrial Average exchange traded fund (DIA) shows a 20-day Simple Moving Average acting as support for prices. When price is in an uptrend and subsequently, the moving average is in an uptrend, and the moving average has been tested by price and price has bounced off the moving average a few times (i.e. the moving average is serving as a support line), then buy on the next pullbacks back to the Simple Moving Average.
Moving Average Acting as Resistance - Sell Signal
At times when price is in a downtrend and the moving average is in a downtrend as well, and price tests the SMA above and is rejected a few consecutive times (i.e. the moving average is serving as a resistance line), then buy on the next rally up to the Simple Moving Average.
A Simple Moving Average can serve as a line of resistance as the chart of the DIA shows:
Thank You !


No comments:
Post a Comment