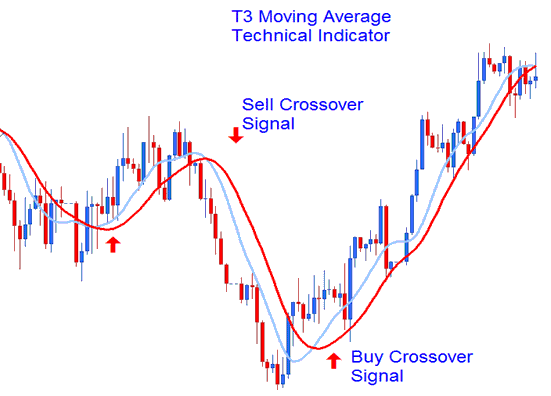
What are Moving Averages?
- Moving averages are one of the most popular and easy to use tools available to the technical analyst. They smooth a data series and make it easier to spot trends, something that is especially helpful in volatile markets. They also form the building blocks for many other technical indicators and overlays.

Significance of Moving Average
- The Moving Average Technical Indicator shows the mean instrument price value for a certain period of time. When one calculates the moving average, one averages out the instrument price for this time period. As the price changes, its moving average either increases, or decreases.
- Moving averages may also be applied to indicators. That is where the interpretation of indicator moving averages is similar to the interpretation of price moving averages: if the indicator rises above its moving average, that means that the ascending indicator movement is likely to continue: if the indicator falls below its moving average, this means that it is likely to continue going downward.
- The two most popular types of Moving average are Simple Moving Average (SMA) and Exponential Moving Average (EMA)
Uses of Moving Average
Trend identification/confirmation
- The first trend identification technique uses the direction of the moving average to determine the trend. If the moving average is rising, the trend is considered up. If the moving average is declining, the trend is considered down. The direction of a moving average can be determined simply by looking at a plot of the moving average or by applying an indicator to the moving average. In either case, we would not want to act on every subtle change, but rather look at general directional movement and changes.
- The second technique for trend identification is price location. The location of the price relative to the moving average can be used to determine the basic trend. If the price is above the moving average, the trend is considered up. If the price is below the moving average, the trend is considered down.
- The third technique for trend identification is based on the location of the shorter moving average relative to the longer moving average. If the shorter moving average is above the longer moving average, the trend is considered up. If the shorter moving average is below the longer moving average, the trend is considered down.
Support and Resistance level identification/confirmation
Another use of moving averages is to identify support and resistance levels. This is usually accomplished with one moving average and is based on historical precedent. As with trend identification, support and resistance level identification through moving averages works best in trending markets.
Conclusion
- Moving averages can be effective tools to identify and confirm trend, identify support and resistance levels, and develop trading systems. However, traders and investors should learn to identify securities that are suitable for analysis with moving averages and how this analysis should be applied.
- The advantages of using moving averages need to be weighed against the disadvantages. Moving averages are trend following, or lagging, indicators that will always be a step behind. This is not necessarily a bad thing though. Moving averages will help ensure that a trader is in line with the current trend. However, markets, stocks and securities spend a great deal of time in trading ranges, which render moving averages ineffective. Once in a trend, moving averages will keep you in, but also give late signals. Don't expect to get out at the top and in at the bottom using moving averages. As with most tools of technical analysis, moving averages should not be used on their own, but in conjunction with other tools that complement them. Using moving averages to confirm other indicators and analysis can greatly enhance technical analysis.
Thank You !

